

What’s happening in the trucking market? It’s the question everyone in the transportation and logistics industry seems to be talking about these days. Last week, J.B. Hunt reported its Q3 2014 financial results, and while a single company does not represent the market as a whole, the chart below basically sums up what I’ve been seeing and hearing overall:
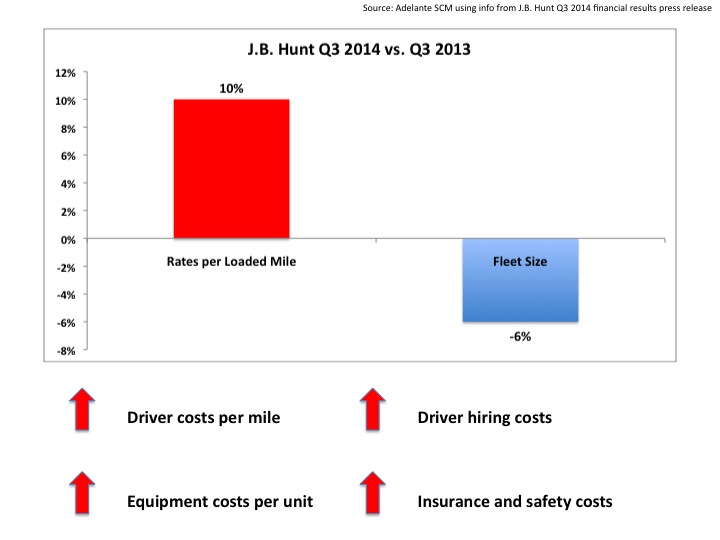
In a nutshell, rates are going up as growth in demand outpaces available capacity (in J.B. Hunt’s case, the company operated 108 fewer tractors in Q3 2014 compared to the same period last year), and as driver, equipment, and other costs go up too.
Swift Transportation, another major truckload carrier, is scheduled to announce its Q3 2014 results this week, but back in July the company reported that its Average Operational Truck Count decreased 7.2% to 10,228 in Q2 of 2014 compared to Q2 2013. The company also stated that “due to the surge in demand for our Dedicated service offering, combined with the tightening driver market, we have elected to shift drivers and equipment from our Truckload segment to our Dedicated segment.”
For both Swift and J.B Hunt, Dedicated services is exhibiting strong demand. Here are some excerpts from their financial press releases (emphasis mine):
Swift: “Dedicated Revenue xFSR grew an impressive 23.3% to $183.3 million in the second quarter of 2014 [compared to Q2 2013]. This growth is driven by numerous new contracts that started in the latter half of 2013 and continued through the first six months of 2014…Over the course of the second quarter 2014, we added approximately 500 operational trucks to our Dedicated segment. With this increase during the second quarter, as well as additional dedicated accounts starting in the third quarter, we expect this segment’s third quarter 2014 average operational truck count to grow 300 to 400 trucks from the second quarter of 2014.
J.B. Hunt: “DCS revenue increased 13% during the current quarter over the same period in 2013. Productivity (revenue per truck per week) increased by approximately 4% vs. 2013 due to increased customer demand at accounts open longer than a year and rate increases implemented during the quarter. A net additional 538 revenue producing trucks were in the fleet by the end of the quarter compared to prior year primarily reflecting new contract implementations in this and prior periods.”
Simply put, these two major trucking companies are moving equipment and drivers from their truckload business segments to dedicated services. For related commentary, see A New Perspective on Dedicated Transportation and Dedicated Fleet and Common Carrier Network: A Match Made in Heaven?
Also last week, DAT Solutions reported that “spot market freight volume set yet another record in September, with a 32 percent increase compared to September 2013 [emphasis mine]. Spot freight has seen 14 consecutive months of year-over-year peaks…Compared to September 2013, freight volume rose for all three equipment categories in the U.S. Load availability for dry vans increased 42 percent, refrigerated (“reefer”) freight increased 24 percent, and flatbed volume added 46 percent.”
What are you doing in response to these trends? Is this just a reflection of the cyclical nature of the transportation market or are we seeing the beginning of a “new normal” emerging? Post a comment and share your perspective.