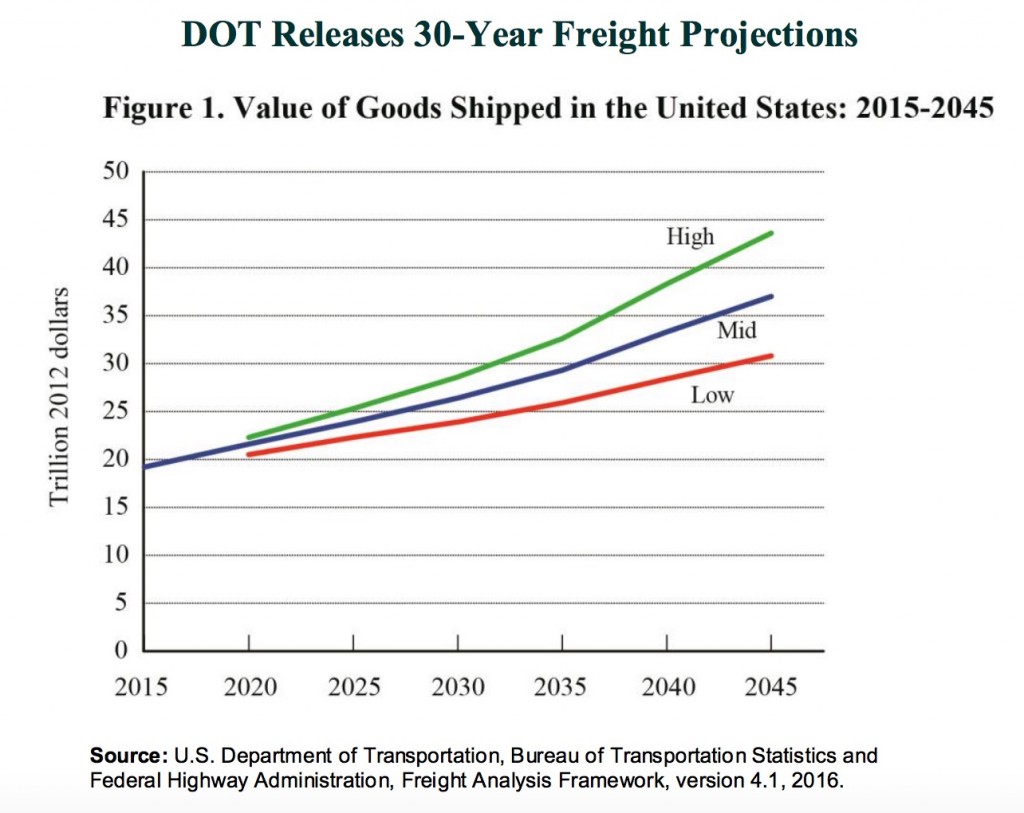
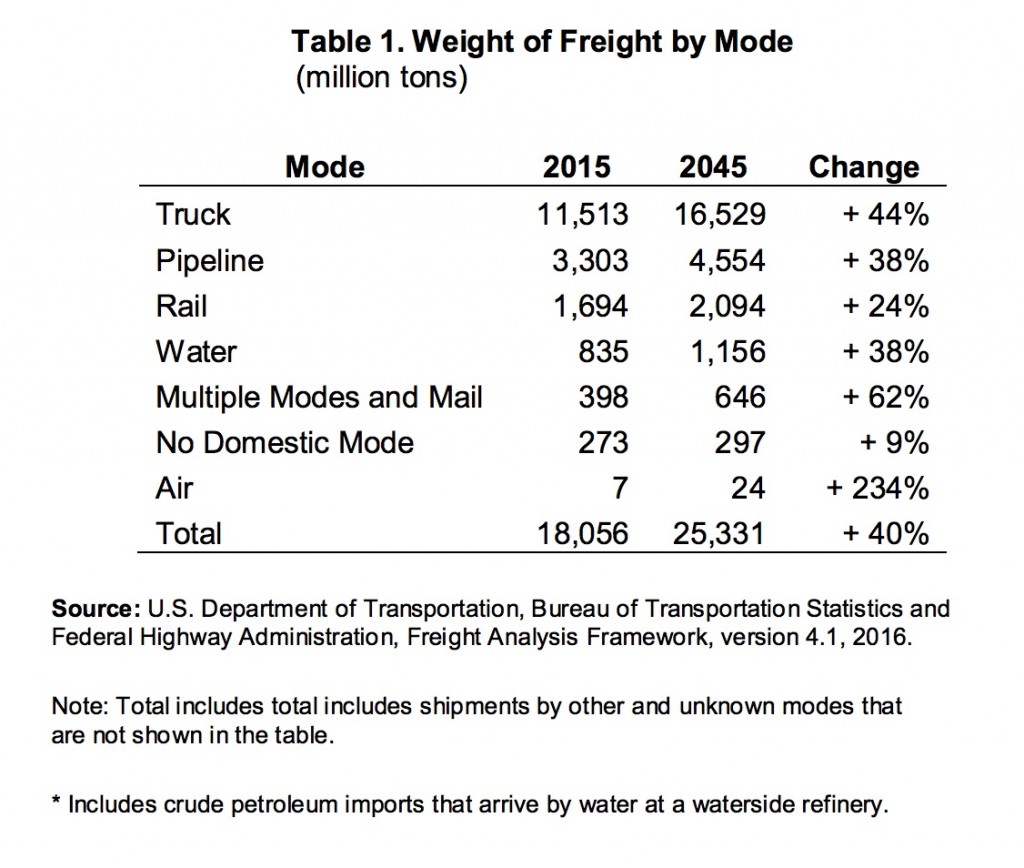
Freight tons moving on the nation’s transportation network will grow 40 percent in the next three decades while the value of the freight will almost double, increasing by 92 percent, according to the latest projections by the U.S. Department of Transportation’s Bureau of Transportation Statistics (BTS) and Federal Highway Administration (FHWA) [October 2022 update: see updated forecast from November 2021]. The projections are from BTS’ and FHWA’s latest version of the Freight Analysis Framework (FAF), “which integrates data from a variety of sources to create a comprehensive picture of freight movement among states and major metropolitan areas by all modes of transportation.”
Here are a couple of charts from the press release:
By 2045, total freight on all modes – air, vessel, pipeline, rail, and trucks – is projected to reach 25 billion tons (up from 18 billion tons in 2015) while the value is expected to grow to $37 trillion (up from $19.2 trillion in 2015).
As the data shows, trucking was the dominant mode of transportation in 2015, accounting for 64 percent of the tonnage and 69 percent of the value moved last year, and it will remain the dominant mode in the decades ahead. Not surprising, considering the ongoing growth of e-commerce, freight moves in tons by “Multiple Modes and Mail” — which includes shipments by parcel delivery services, U.S. Postal Service, or couriers — is expected to grow 62 percent through 2045, second only to Air in growth rate.
Needless to say, you can analyze and dissect the data in many different ways, and you can argue with the assumptions behind the projections if you wish, but the data raises two important questions for me:
Will our nation’s transportation infrastructure be able to handle such growth in freight moves?
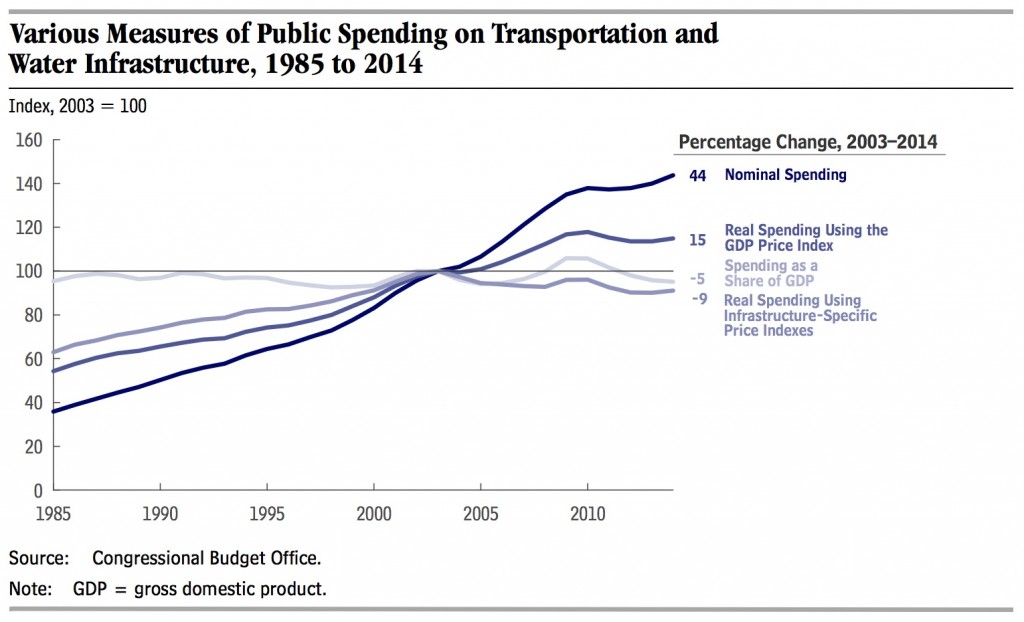
That is the “hundreds of billions of dollars” question. The Federal Highway Administration estimates that $170 billion in capital investment is needed annually to significantly improve road conditions and performance. Meanwhile, the 2013 American Society of Civil Engineers’ (ASCE) Report Card for America’s Infrastructure gives roads a D grade — with other transportation infrastructure not doing much better (bridges earned a C+, ports a C, inland waterways a D-, and rail a C+). The Congressional Budget Office (CBO), in a report published last year titled Public Spending on Transportation and Water Infrastructure, 1956 to 2014 [see updated report from 2018], showed the decline in real, inflation-adjusted spending from 2003 to 2014:
From the report:
Nominal public spending on that infrastructure increased by 44 percent between 2003 and 2014, but because prices of materials and other inputs rose more quickly than nominal spending, real (inflation-adjusted) public purchases decreased, falling by 9 percent from their peak in 2003 to their level in 2014.
Adjusted for inflation, federal purchases have fallen by about 19 percent since 2003, while purchases by states and localities have fallen by about 5 percent. The significant difference between those declines reflects the facts that a much larger portion of federal infrastructure spending than of state and local spending is for capital and that capital has become much more expensive to purchase over the period relative to operation and maintenance services.
Now take into account how long it took for Congress to pass a long-term $305 billion highway bill, which allocates $205 billion for highways over the next five years (an average of $41 billion per year versus the $170 billion annually the Federal Highway Administration recommends), and if you also factor in the accounting gimmicks used to pay for it, the ongoing debate on the gas tax and other funding mechanisms, and how transportation infrastructure is barely getting any attention from the presidential candidates, and what you get is a big red flag waving over the future of our nation’s transportation infrastructure and its ability to cost-effectively and safely handle the projected growth in freight moves.
What impact will emerging modes of transportation — such as drones, driverless trucks, and “share economy” delivery models — have on how freight will actually move in the year 2045?
The problem with 30-year projections is that they are heavily influenced by what we know and understand today, and since the future is truly unknown, such long-term projections are just as likely to be wrong than right.
But even if the projections for freight tons and value are directionally correct, what we end up defining as “Air” and “Truck” transportation in 2045 might be different than how we define those modes today — and we might even add a new mode or two to the list in the future.
Take cargo airships, for example. A couple of weeks ago, The New Yorker published an article highlighting how “a new generation of airship engineers, some backed by significant government and private investment, is convinced that, given new technologies and new materials, the public can be sold on airships.” The article goes on:
Last March, the U.S. House of Representatives set up the bipartisan Cargo Airship Caucus, with the goal of accelerating development. In recent years, the aerospace heavyweights Boeing and Northrop Grumman have developed airships; Russia, Brazil, and China have built or conceived prototypes, and Canada has designs for a few of them, including the Solar Ship, which looks like a bloated stealth bomber, with solar panels spread across the top of helium-filled wings. All are racing to be first to corner a cargo market that may be worth billions. Three projects are currently attracting the most attention: the Airlander 10, which is scheduled to launch next month, in England; Lockheed Martin’s LMH-1; and [Worldwide Aeros’] Aeroscraft.
Watch the videos below from Lockheed Martin and The New Yorker about Aeroscraft CEO Igor Pasternak for more insights.
Simply put, I believe the way freight will actually move in 2045 will be different than how it moves today. The percentages and numbers in the Freight Analysis Framework are interesting, but it’s how we actually get there that will be most exciting.


